News · European Union
EU house prices up 4.7% in a year: Eurostat data for Q2 2026

Updated: October 2026·14 min read·Expert reviewed
Terms and costs verified: October 2026
Contents
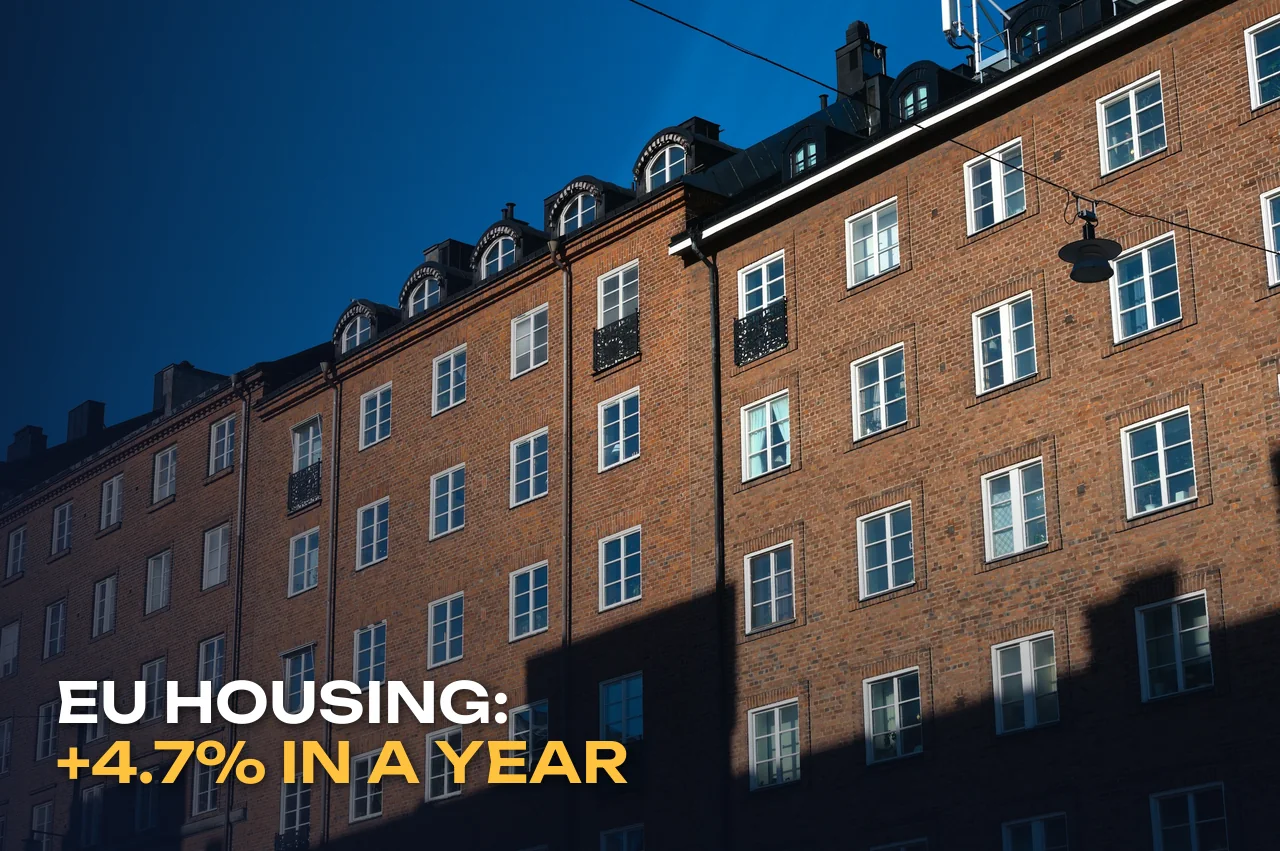
On 1 October 2026 Eurostat published housing data for the second quarter. House prices in the European Union rose by 4.7% year on year, by 4.0% in the euro area, and rents in the EU went up by 3.0%. Growth slowed slightly compared with the start of the year, but the gap between countries is huge: in Portugal and Bulgaria homes became more than 15% more expensive in a year, while in France, Luxembourg and Finland they became cheaper. I went through Eurostat's tables for the countries where we run residence programmes and explain what these figures mean for a buyer and for a rental investor.
In brief
- In Q2 2026 house prices in the EU rose by 4.7% compared with Q2 2025, and by 4.0% in the euro area. Quarter on quarter: +1.2% and +1.1%.
- Rents in the EU rose by 3.0% over the year and by 0.7% over the quarter. Purchase prices are growing faster than rents.
- The fastest annual price growth was in Portugal (+16.5%), Bulgaria (+15.5%) and Lithuania (+14.3%).
- Prices fell in three countries: Finland (-2.7%), Luxembourg (-2.2%) and France (-0.8%).
- Eurostat does not publish a house price index for Greece: transaction data are not available. Rents in Greece rose by 7.5% over the year, according to my calculation from the Eurostat index.
- The index shows a national average. The price of a specific flat in Lisbon or on Crete can behave very differently.
What Eurostat published: 4.7% in the EU and 4.0% in the euro area
Eurostat's house price index covers all residential properties bought by households: flats, detached and terraced houses, new and existing. It does not matter whether they are bought to live in or to let. Eurostat takes rents from the consumer price index: these are actual rental payments for housing. Both series are comparable across countries, which makes them convenient for comparing EU markets with one another.
| Indicator | EU | Euro area |
|---|---|---|
| House prices, Q2 2026 vs Q2 2025 | +4.7% | +4.0% |
| House prices, Q2 2026 vs Q1 2026 | +1.2% | +1.1% |
| House prices, Q1 2026 vs Q1 2025 | +5.1% | +4.6% |
| Rents, Q2 2026 vs Q2 2025 | +3.0% | +2.7%* |
| Rents, Q2 2026 vs Q1 2026 | +0.7% | - |
* Euro area rents over the year are my calculation from Eurostat's monthly rent index (average for April - June 2026 against the same period of 2025). All other figures in the table are published by Eurostat.
The main point in the dynamics is the slowdown. In Q1 2026 EU prices grew by 5.1% a year, in Q2 by 4.7%. The peak of the latest cycle came in early 2025: according to Eurostat, annual growth in the EU then reached 5.8%. Quarterly growth, on the other hand, picked up slightly: +1.1% in Q1 and +1.2% in Q2. The market is not cooling sharply; it is simply growing a little more calmly than a year ago.
To compare with prices for everything else, see our article on euro area inflation in September 2026. According to Eurostat, in 2025 housing in the euro area rose 3.1% more than consumer prices. In other words, in real terms homes became more expensive rather than merely keeping up with inflation.
What this means for you. If you have been postponing a purchase in the hope that European prices would go down, Eurostat's data do not show that. In most EU countries housing keeps getting more expensive, although more slowly than in 2025.
Where homes are getting more expensive fastest, and where they are getting cheaper
Of the EU countries with available data, prices rose over the year in 23 and fell in three. The growth leaders in Q2 2026 were Portugal (+16.5%), Bulgaria (+15.5%) and Lithuania (+14.3%). They were followed by Slovakia (+13.6%), Croatia (+12.7%), Spain (+12.1%), Romania (+12.1%) and Latvia (+11.4%). Prices fell in Finland (-2.7%), Luxembourg (-2.2%) and France (-0.8%). Germany barely moved: +0.6% over the year.
Quarter on quarter the picture is slightly different. Homes rose most in Lithuania (+5.0%), Bulgaria (+4.5%) and Romania (+4.4%). They became cheaper in two countries: Hungary (-1.4%) and France (-0.8%). For Hungary this is a notable turn: as recently as Q3 2025 annual growth there reached 21.7%; now it has dropped to 10.2%, and the quarter ended with a decline.
Eurostat also compares Q2 2026 with the 2025 annual average. On that measure, prices rose faster than rents in all 18 EU countries where both series are available. Rents rose in every EU country over this period, most of all in Romania (+41.2%), Croatia (+22.1%) and Slovenia (+10.2%), and least in Estonia and Finland (+0.1% each) and Luxembourg (+1.2%). Eurostat does not explain jumps such as those in Romania and Croatia in its release, so I would be careful about drawing market conclusions from them.
A separate note on Czechia: prices there rose by 8.6% over the year. How far housing in Prague has moved out of reach for local residents is something we calculated in the article on a Prague flat costing 17 annual salaries.
What this means for you. Fast price growth is both a plus and a minus. If you have already bought in Portugal or Bulgaria, your property has gained value. If you are only choosing, entry into these markets is more expensive and there is less room for further growth.
Countries where we run programmes: prices and rents
Below are Eurostat figures for countries where we arrange residence permits and where clients most often ask about housing. Annual and quarterly price changes are published by Eurostat. Growth since early 2015 and annual rent growth are my calculations from Eurostat indices.
| Country | Prices, year | Prices, quarter | Rents, year* | Prices since early 2015 |
|---|---|---|---|---|
| Portugal | +16.5% | +3.6% | +5.2% | +211% |
| Bulgaria | +15.5% | +4.5% | +9.9% | +188% |
| Croatia | +12.7% | +2.7% | +40.1% | +150% |
| Spain | +12.1% | +3.4% | +2.5% | +108% |
| Latvia | +11.4% | +3.9% | +4.5% | +142% |
| Hungary | +10.2% | -1.4% | +4.2% | +316% |
| Cyprus | +7.9% | +2.4% | +4.3% | +63% |
| Malta | +6.9% | +1.6% | +3.1% | +93% |
| Austria | +5.1% | +3.3% | +5.0% | +79% |
| Italy | +4.0% | +1.7% | +3.5% | +21% |
| Greece | no data | no data | +7.5% | no data |
| EU as a whole | +4.7% | +1.2% | +3.0% | +72% |
* Rents over the year: average of Eurostat's rent index for April - June 2026 against April - June 2025. Price growth since early 2015: the Q2 2026 index against the Q1 2015 index. These are nominal figures, not adjusted for inflation.
Portugal. The fastest price growth in the EU: +16.5% over the year and +3.6% over the quarter. Since early 2015 homes in the country have roughly tripled in price, while rents over the same period rose by 43%. At the same time, buying a home no longer qualifies for the Portugal golden visa: this option was removed from the programme in 2023. The options that remain are described on the page on the Portugal golden visa. How rents are rising in Lisbon and other cities we covered in the article on European rents in autumn 2026.
Greece. Eurostat does not publish a house price index for Greece: transaction-based data are not available, and for the EU aggregates Eurostat uses Bank of Greece estimates based on valuations. Rents, however, are visible: +7.5% over the year, one of the highest figures among our countries. The threshold and conditions of the programme are described on the page on the Greece golden visa, and regional prices in the review of property prices in Greece in 2026.
Spain. +12.1% over the year; since early 2015 prices have roughly doubled. Rents are growing much more slowly: +2.5% over the year. Spain closed its golden visa in April 2025, so buying a home there no longer leads to residence. Other ways to move are collected on the page about Spain.
Cyprus. +7.9% over the year and +2.4% over the quarter. This is an acceleration: in Q1 annual growth was 3.4%. Cyprus permanent residence can still be obtained by buying a new home; the conditions are on the page on Cyprus permanent residence. We analysed prices by city in the article on Cyprus property prices in 2026.
Italy. The calmest market among our countries: +4.0% over the year. Since early 2010 prices in Italy have risen by only 4% in nominal terms, and by 21% since early 2015. The Italian investor visa is not linked to buying a home; it is described on the page on the Italy investor visa. If you are moving to live on your income, you need housing in Italy for the elective residence visa. Regional prices are in the review of property prices in Italy.
Hungary. +10.2% over the year but -1.4% over the quarter: the only country apart from France where homes became cheaper in Q2. Since early 2015 prices have more than quadrupled, the highest figure among the countries in our table. The Hungary guest investor programme lets you invest in property through a fund rather than buy a flat directly.
Bulgaria, Latvia, Croatia, Malta. Bulgaria: +15.5% over the year, the second-highest result in the EU; a city-by-city breakdown is in the article on property prices in Bulgaria. Latvia: +11.4%, Croatia: +12.7%. Malta shows moderate growth: +6.9% over the year. For Malta permanent residence you need to buy or rent a home, so both prices and rents matter to an applicant.
What this means for you. If you are choosing a residence country where housing is part of the programme conditions, look not only at the investment threshold but also at how fast the market is growing. The threshold is fixed by law; the price of the property you need is not.
Want to buy a home in Europe? We will find options
We will send a selection of properties for your budget.
Prices versus rents since 2010: homes up 70%, rents up by a third
Eurostat shows long series from 2010. Until mid-2011 prices and rents in the EU moved together, then they diverged. Rents rose steadily, year after year. Prices first fell until 2013, then held flat, and from early 2015 to Q3 2022 climbed sharply. After that came a small decline, stabilisation and, from 2024, renewed growth.
I calculated the result from Eurostat indices. From Q1 2010 to Q2 2026 house prices in the EU rose by about 70%, and rents by about 33%. In the euro area the figures are 59% and 31% respectively. Homes became more expensive twice as fast as rents.
This directly affects returns. If a flat's price grows faster than its rent, rental yield on the purchase price falls. A buyer entering the market today pays more for the same rental income than a buyer in 2015. In Portugal this gap is especially visible: prices have tripled since 2015, rents have risen by 43%.
There are opposite examples too. In Germany, France, Luxembourg and Finland prices fell after the 2022 peak and have still not returned to it, while rents kept rising. In such countries yield on the purchase price has, on the contrary, gone up. But we do not have property residence programmes there, so for our clients this is more of a background.
What this means for you. If you are buying to let, calculate the yield at today's price and today's rent, not on past growth. Past price growth is already built into the value of the property.
What this means for a buyer seeking residence or a home to live in
For a residence buyer the key figure is the programme threshold. It is set by law in euros and does not move with the market. If prices grow by 10-15% a year, the same amount buys less: a smaller floor area, a district further from the centre, a resale flat instead of a new build. This is felt especially in Greece, where the programme thresholds depend on the region, and in Cyprus, where permanent residence requires a new property.
The second point is the full cost of the deal. On top of the price, the buyer pays transfer tax or VAT, notary, registration, a lawyer and sometimes an agent. These costs are calculated on the price, so they grow with it. How we calculate the total budget is described in the guide to property purchase costs and in the section on how costs and timelines are calculated.
The third point is family. If you are moving with children, you need a bigger flat, and price growth hits the budget harder. Which documents are needed for a spouse, children and parents is collected in the guide on residence for the whole family.
What this means for you. If you are buying to live, rising prices are no reason to rush your choice of property. A year or two of 10% growth will do less harm than the wrong district or a problematic title. First check the property, then think about speed.
For a rental investor: where the market is overheated and where it is calmer
Based on Eurostat data, I would divide our countries into three groups. This is not a forecast but a description of what the Q2 2026 figures show.
- Fast price growth, rents lagging. Portugal, Spain, Bulgaria, Latvia. Prices are growing by 11-17% a year, rents by 2.5-10%. Yield on the purchase price is falling here. It makes sense to buy for specific demand in a specific district, not for "the market" as a whole.
- Moderate growth, prices and rents closer together. Italy, Malta, Cyprus, Austria. Prices are growing by 4-8% a year, rents by 3-5%. These markets are calmer, with fewer surprises, but on these data there is no reason to expect rapid gains in value either.
- A mixed picture. Hungary and Croatia. In Hungary prices rose 10.2% over the year but fell 1.4% over the quarter. In Croatia prices rose by 12.7%, while rents, according to Eurostat's index, rose by 40%. Such sharp divergences are a reason to look at national statistics and at the specific city before deciding.
A separate note on Greece. Rents there are growing by 7.5% a year, which is high, but Eurostat has no transaction-based price index. So in Greece I would calculate yield only from real listings and contracts in the district you need. What yield looks like in practice in Portugal we analysed in the article on rental yield in Portugal. For the overall picture of EU rental markets, see the review of rent growth in Europe in 2026.
Do not forget taxes either. Rental income is taxed in the country where the property is located, and, if you relocate, also in the country of your tax residence. An example of how this works is in the article on Portuguese tax residency.
What this means for you. If you are an investor, compare countries by yield after taxes and management costs, not by the pace of price growth. Strong price growth yesterday does not guarantee the same growth tomorrow.
The index is a national average, not a district figure
This is the main limitation of all the figures above. Eurostat's index shows how house prices changed on average across the whole country. It does not tell you what a flat costs in central Lisbon, on Crete or in Limassol, nor how much it has gained. Capitals, resort areas and new builds often grow faster than average; small towns and older housing more slowly.
In addition, the index compares prices for a quarter with the same quarter a year earlier. Quarterly figures can fluctuate: in Cyprus, for example, annual growth was 6.0% in Q4 2025, 3.4% in Q1 2026 and 7.9% in Q2. One quarter is not a trend. For Greece, as I have said, there is no transaction-based index at all.
That is why before a purchase we look at three levels: the overall national market according to Eurostat, national statistics and land registry data for the region, and real deals and listings in the specific district. How to check the property itself (documents, debts, permits) is described in the guide on checking a property. A selection of properties is available in the section on real estate.
What this means for you. If someone quotes you price growth "for the country", ask what is happening in your district and in your type of housing. The average figure can differ greatly from your situation.
What a buyer should do now
Define the purpose of the purchase
Residence, living or rental. The purpose determines the country, the threshold, the property type and which figures to look at.
Compare countries using Eurostat data
Price growth, rents and the gap between them. The table above is a good starting point.
Go down to district level
Look at national statistics, the land registry and real deals in the city you need. The national average is only background.
Calculate the full budget
Price, taxes, notary, lawyer, renovation, management. For rentals, yield after tax.
Check the property before signing
Title, encumbrances, permits and compliance with the residence programme conditions.
If you would like to go through your situation, book an online consultation: we will compare countries and properties for your purpose. An overview of all our services is on the BRIDGES home page.
How this article was prepared
The article is based on Eurostat's news release of 1 October 2026 "House prices and rents continued to rise in Q2 2026", the Statistics Explained article "Housing price statistics - house price index" (data from 1 October 2026) and Eurostat tables prc_hpi_q (quarterly house price index) and prc_hicp_minr (rent index within the consumer price index, monthly data). Annual and quarterly price changes by country are taken from the prc_hpi_q table. Price growth since 2010 and 2015, as well as annual rent growth by country and for the euro area, are my own calculations from Eurostat indices; they are nominal figures not adjusted for inflation. Eurostat does not publish a house price index for Greece. The article contains no forecasts. It does not replace advice on a specific transaction.
Share this article
Frequently asked
Questions people ask before deciding
01How much did EU house prices rise in Q2 2026?
According to Eurostat, by 4.7% compared with Q2 2025 and by 1.2% compared with Q1 2026. In the euro area, by 4.0% over the year.
02Where are homes getting more expensive fastest?
In Portugal (+16.5% over the year), Bulgaria (+15.5%) and Lithuania (+14.3%). Prices fell in Finland, Luxembourg and France.
03How did rents change?
In the EU rents rose by 3.0% over the year and 0.7% over the quarter. Since 2010 EU house prices have risen by about 70%, and rents by about a third.
04Why is there no data for Greece?
Eurostat does not publish a house price index for Greece because transaction-based data are not available. For EU aggregates, Bank of Greece estimates are used.
05Can the Eurostat index be used to value a specific flat?
No. The index shows the average change in prices across the country. Prices in a particular city or district may grow faster or slower and must be checked against local data and deals.
About the author
Related materials
What to read next
 NewsRenting in Europe in autumn 2026: Portugal lifts limits on landlords, Spain freezes rents
 GuideRent in Europe in 2026: where prices rose most and why the index lags
News+6 stories on 25 October
Related news
 European Union · 25 OctEU visa waiver for the Gulf states: the Council has started the process, but visas are still required
 European Union · 23 OctEuro area inflation rises to 3.8%: energy up 18.8%, protests across Europe
 European Union · 23 OctETIAS is not operational: what changed in EES border checks
Personal programme selection is conducted by Anna Kovalevskaya, Head of Legal, BRIDGES.
Want residency through buying a home? We will compare countries
We will compare suitable options and send you a short table.